Percent to Decimal Chart
A percent-to-decimal chart looks simple, but it solves a real problem: repeated small conversion errors destroy larger calculations. Students usually know the rule in theory, yet still lose points because they hesitate over decimal place movement or fail to recognize when a value above 100% should become greater than 1.0. A good chart is useful not because the rule is hard, but because repetition creates opportunities for sloppy mistakes.
The chart below is most valuable when used as a reference plus a reasoning tool. You should not read it as a list to memorize blindly. You should read it as a set of anchor conversions that train your intuition. Once those anchors feel natural, unusual percentages become easier to estimate and verify.
Applicable Use Cases
These conversions appear in discounts, tax, tips, grades, survey results, growth rates, science data, and finance examples. The decimal form is especially helpful when a percent becomes part of multiplication, division, or a longer calculator expression. That is why percent-to-decimal conversion shows up constantly even in chapters that are not officially labeled "percent."
For example, a discount problem may ask for 15% of a price, a lab report may present concentration as a percent, and a grade report may convert a score into decimal form for later calculations. In each case, the decimal version usually makes the arithmetic cleaner.
Core Ideas
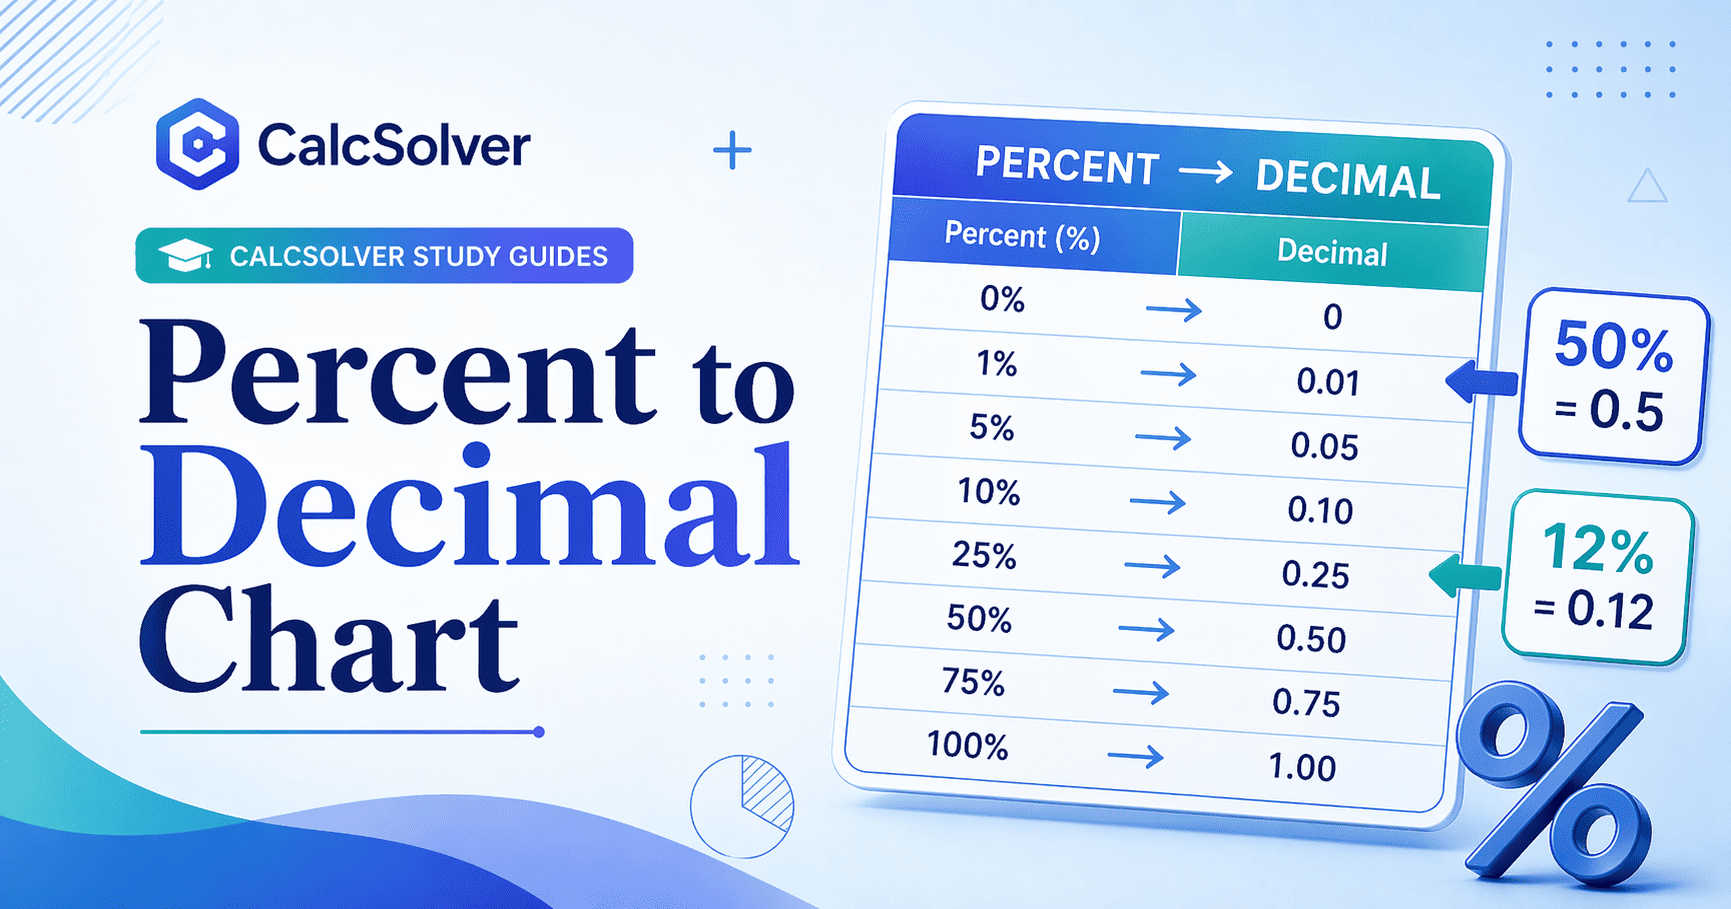
Percent means per hundred, so converting percent to decimal means dividing by 100. That is why 25% becomes 0.25 and 5% becomes 0.05. The decimal point moves two places to the left.
But the stronger principle is not the movement rule. The stronger principle is scale. If the percent is less than 100%, the decimal should be less than 1. If the percent is exactly 100%, the decimal is 1. If the percent is greater than 100%, the decimal should be greater than 1. That way of thinking catches many mistakes immediately.
It also helps to know a few anchor values extremely well: 1% = 0.01, 10% = 0.10, 25% = 0.25, 50% = 0.50, 75% = 0.75, and 100% = 1.00. These anchors act like checkpoints. If a new conversion feels strange, compare it to the nearest known anchor first.
Quick Reference and Examples
Here is a practical reference list:
- 1% = 0.01
- 5% = 0.05
- 10% = 0.10
- 12% = 0.12
- 15% = 0.15
- 20% = 0.20
- 25% = 0.25
- 50% = 0.50
- 75% = 0.75
- 100% = 1.00
- 120% = 1.20
Example 1: 12% becomes 0.12. If a worksheet asks for 12% of 250, you can now compute 0.12 * 250.
Example 2: 150% becomes 1.50, not 0.15. This matters whenever a quantity is larger than the original whole.
Example 3: 0.5 as a decimal means 50%, not 5%. That anchor alone prevents a large number of mistakes in data and grade interpretation.
Example 4: If a worksheet asks for 15% of 80, convert 15% to 0.15 first and then multiply. That gives 12. The chart reduces hesitation during the first step.
Common Mistakes
The biggest error is moving the decimal in the wrong direction. Another common mistake is forgetting that 0.5 means 50%, not 5%. Students also sometimes confuse a plain percent conversion with percent change between two values, which is a different calculation entirely.
A subtler mistake is assuming that all percentages should convert to decimals smaller than 1. That is only true for percentages below 100%. Once the percentage passes 100, the decimal must be greater than 1.0.
Students also rely too heavily on mechanical movement without checking scale. If 250% becomes 0.25 in your notes, the decimal-place rule was applied incorrectly, but the bigger issue is that the answer should have felt wrong immediately.
FAQ
Can a percent be larger than 100%?
Yes. In decimal form it will be larger than 1.0. For example, 120% becomes 1.20.
Should I memorize every conversion?
No. Memorize the rule and a few anchors such as 1%, 10%, 25%, 50%, and 75%. The rest can be reasoned from there.
Why use a chart if the rule is simple?
Because speed and error reduction matter when solving many problems in a row. The chart acts as a calibration tool, not just a shortcut.
What is the fastest way to check if my conversion is reasonable?
Ask whether the decimal should be less than 1, equal to 1, or greater than 1. That one check catches many mistakes instantly.
Difference from Nearby Tools
Use the Percent Calculator when you want direct conversions, percent of a value, or percent change. Use the Fractions tool when you want exact forms like 3/4 instead of 0.75. Use the Scientific Calculator for longer chained calculations after the conversion is done. This chart is the reference layer that helps you move confidently between forms before using those tools.
Study Advice
Build a short anchor list and check new answers against it. If a result feels too large or too small, re-check the decimal place before continuing. That habit is much faster than fixing a whole page of percent mistakes later.
It also helps to practice in both directions. Convert percent to decimal, then convert the decimal back into percent. Reversing the process strengthens understanding and exposes weak spots quickly. A chart works best when it trains judgment, not when it replaces it.
Applied learning context
How this topic appears in real coursework
In real classes, this topic usually appears inside mixed assignments instead of in isolation. Students may need to combine definitions, formulas, and interpretation in a single response, which is why practicing only one template answer is often not enough. A stronger routine is to check what the question is really asking, identify the required variables, then map the setup to the correct method before calculating.
Common reasoning traps and how to prevent them
The most frequent mistakes happen before arithmetic starts: reading symbols too quickly, mixing units, applying the wrong formula, or skipping assumptions. To avoid this, write a short pre-check line for each problem: identify known values, unknown values, constraints, and expected answer size. This one-minute habit prevents many avoidable errors and improves final answer quality more than repeated button pressing.
How to self-verify before submitting answers
After solving, verify by estimation and by method. Estimation checks whether the result is in a plausible range. Method checks whether each step still matches the original question intent. If either check fails, revise the setup first instead of retyping numbers. This approach builds transferable problem-solving skill, not just short-term answer accuracy.